The Audio Map Editor
The Audio Map Editor, which is available with an Audio or Bundle license installed, allows you to customize the configuration and behavior of an audio map. If you do not have an appropriate license installed, you can use the Audio Map Editor to view maps, but not edit them.
If you have not yet looked at the introduction to Object Audio in QLab, now is a great time to do that.
Editing a map comprises these steps:
- Set the name and dimensions of the map,
- Optionally add a background image,
- Add and configure marks to define how objects should sound across the map,
- Optionally add filters to delineate sections of the map,
- Optionally add map objects for cues to use later,
- Test the map to make sure it behaves the way you want.
To open the Audio Map Editor, visit Workspace Settings → Audio → Audio Maps, the click the Edit button next to the audio map that you wish to edit. Alternately, you can select to any cue which uses the audio map, navigate to the Objects tab of the inspector, and click the Edit Audio Map button in the lower left corner.
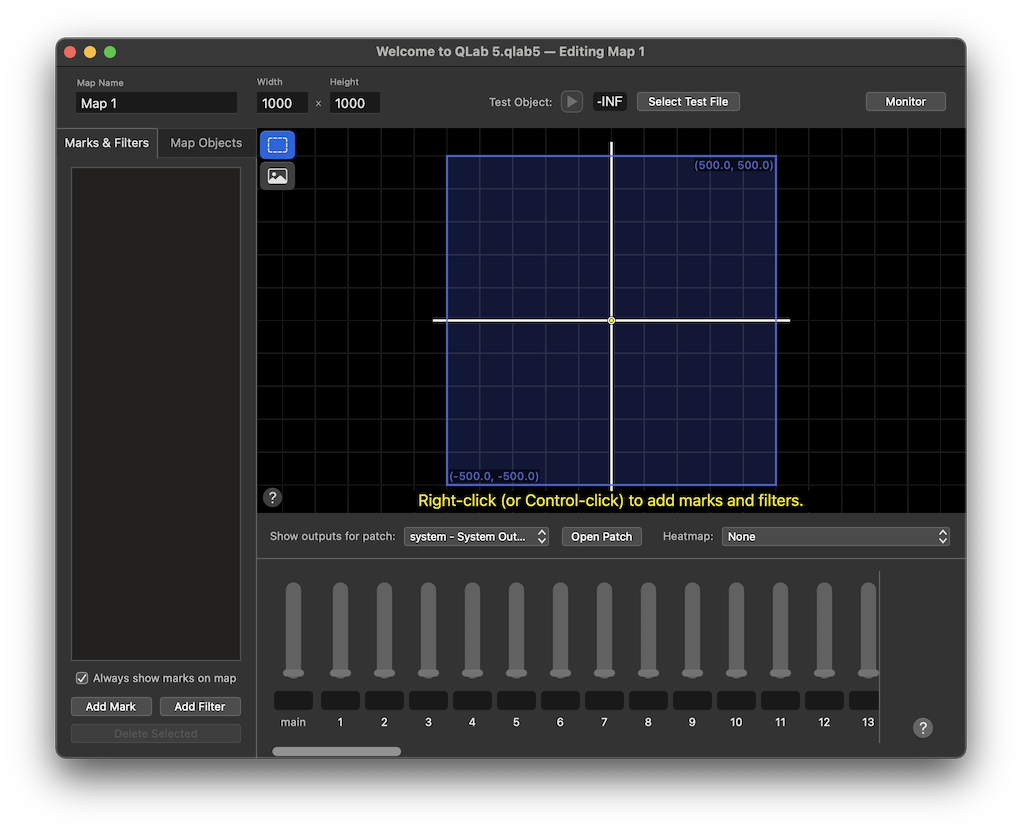
At the top of the Audio Map Editor are several controls:
- The Map Name field lets you edit the name of the map.
- The Width and Height fields let you set the size of the map.
- The Test Object controls let you select an audio file to use as a test sound while working with the map, set its playback level, and play and pause it. The test object is explained in more detail below.
- The Monitor button opens a monitor window which lets you view the live status of the map and all objects within it.
The default size of an audio map is 1000 × 1000. While there is no upper or lower limit on map sizes, extremely small and extremely large maps will run into practicality considerations. Map dimensions are unit-less and do not inherently represent real physical space. If you want to use an audio map as a representation of real space, you could of course decide that map size units will correlate to centimeters or inches or parsecs or furlongs, and then arrange the various elements in your map according to that decision, but it’s essential to understand that this is entirely optional. The object audio system in QLab is designed to operate in a spatially agnostic manner.
Objects can move outside the boundaries of the map, much the same way that Video cues can be placed outside the boundaries of a display. The size that you choose for the map should be thought of as the size of the space you will typically work within.
On the left side of the window are two tabs: Marks & Filters and Map Objects. The selected tab determines what you can edit and what you can see in the rest of the Audio Map Editor window.
Marks & Filters
The Marks & Filters tab displays a combined list of the marks and filters in the map, with marks above and filters below. You can double-click on a mark or filter to rename it, and drag marks and filters up and down the list to reorder them.
Below the list, the Always show marks on map checkbox lets you display or hide the mark icons in cue inspectors, monitor windows, and the Map Objects tab. Only the marks’ visibility is affected, not their behavior. The simplest example of when you might want to uncheck this box is when using a background image with your map that has visible details that line up the positions of your marks, like speakers.
The Add Mark button adds a new mark to the map. You can also add a mark by right-clicking (or control-clicking or two-finger-clicking) in the canvas.
The Add Filter button adds a new filter to the map. You can also add a mark by right-clicking (or control-clicking or two-finger-clicking) in the canvas.
The Delete Selected button, which is only available when at least one mark or filter is selected, deletes the selected item(s). You can also use the ⌫ key. Deleting is undoable, of course.
The Canvas for Marks & Filters
When the Marks & Filters tab is active, marks are displayed on the canvas with their name and coordinates. Filters are displayed on the canvas, also with their name and coordinates, and with lines extending to the edges of the canvas which show their angle and width.
The two buttons in the upper left corner allow you to switch between the select tool, which lets you interact with marks, filters, and map objects on the map, and the background tool which lets you add, remove, and adjust the map’s background image.
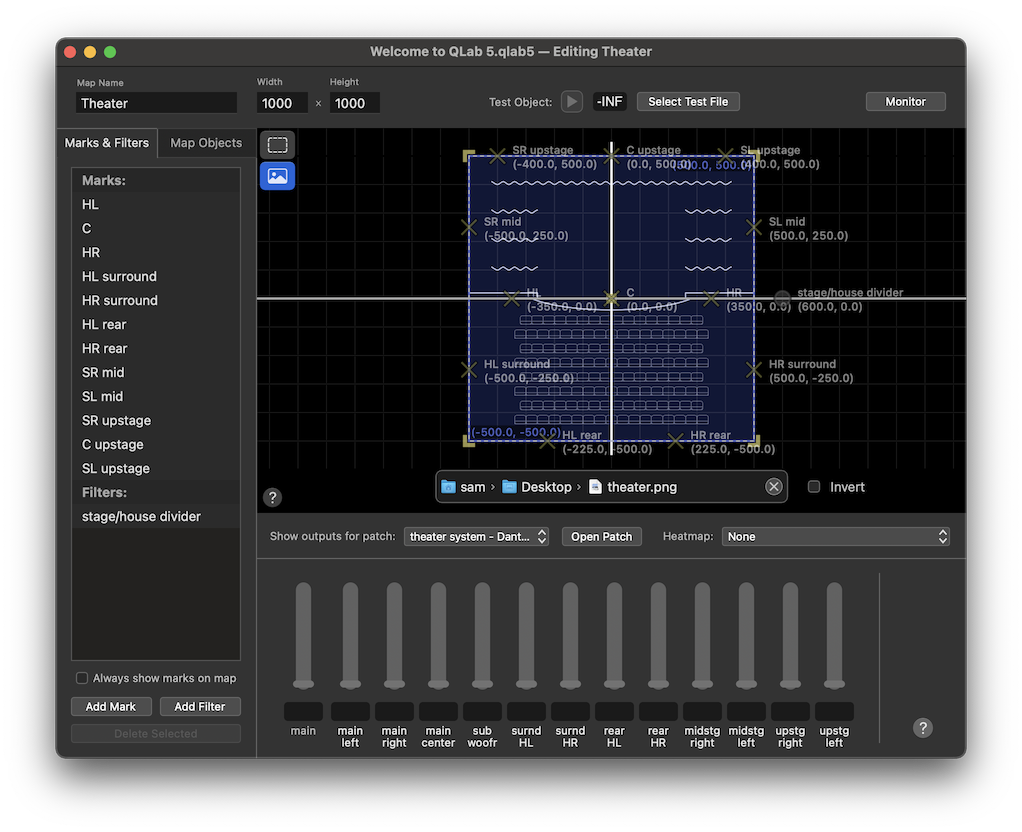
When the background tool is active, you can add a background image by dragging and dropping it into the canvas. Any image file format supported by QLab will work, but we recommend png or jpg images because of their small file size. QLab will offer to resize your map to the pixel dimensions of your image, which may be useful if you’ve made the image a specific size for this reason. You can also resize the background image by dragging on its edges or corners. If your image is generally light in color with dark lines, you may find that checking the invert checkbox makes it easier to see.
The help button at the bottom left of the canvas displays a list of the keyboard shortcuts and modifiers that are available when working in the canvas.
Show outputs for patch
Maps do not belong to any one audio output patch, but it can be convenient to use an audio output patch to “audition” a map as you build it. When the Marks & Filters tab is active, you can use the Show outputs for patch pop-up menu to select an audio output patch. When a patch is selected, the cue outputs labels of that patch will appear in the inspector, and sound from the test object will be routed through that patch. No actual connection between the map and the audio output patch is made; this is purely a testing tool.
The Open Patch button lets you quickly open the Audio Output Patch Editor for the selected patch.
Heatmaps
The Heatmap pop-up menu lets you select a cue output to visualize on the canvas. The heatmap shows a representation of the level of an object in the chosen cue output at every point across the map.

The heatmap scale is calibrated in twenty three increments, with all levels above 0 dB in the first step (nearly white), then twenty one steps from 0 (very light pink) down to -60 (very dark purple), and -inf in the last step (black).


Since QLab does not (and in fact cannot) know about the physical specifics of your sound system and your venue, this map does not represent actual absolute loudness (dB SPL). It represents the relative level of an object as it is routed into a cue output.
To be exact, it’s the boundary between each color that represents the indicated level. Each color represents a range of levels between the boundaries.

If your workspace’s minimum volume limit is lower than -60, then the very dark purple color at the end of the scale will represent all levels between -60 and just above -inf.
If you are using a map to represent real space, it can be tempting to think of the heatmap as an approximation of how things might sound to a listener in a particular spot in the theater. This temptation must be resisted! The heatmap is an approximation of how things might sound when an object is in a particular spot in the theater.
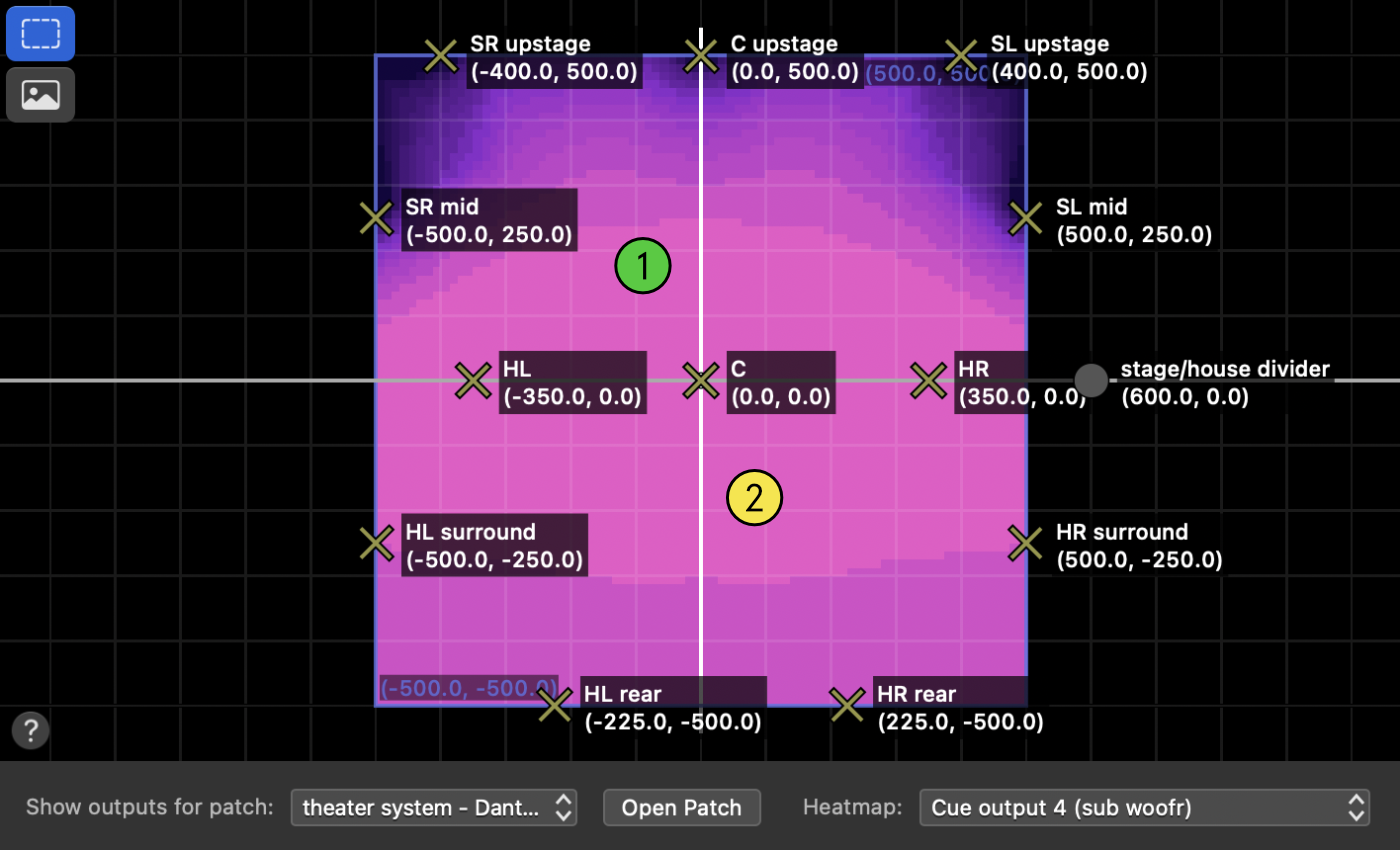
In the screen shot above, the heatmap is showing the level of cue output 4, which is the subwoofer output. By looking at this heatmap, you can be confident that objects placed at location 1 and 2 will be heard in the subs at approximately the same volume, certainly within 3 dB of each other. But QLab doesn’t know where the subs are located, whether they are cardioid or omnidirectional,
and so on. So if people go and stand or sit at location 1 or location 2, they may have very different experiences.
Option-hover
Another visualization tool that can help you as you configure your map can be used by holding down the option key (⌥) and moving your mouse cursor around the map. As you do, the levels in the inspector will update live to show output levels as though the mouse cursor were an object. This lets you slide your mouse around the map and answer the question, “how would an object be routed if it were sitting right here?”
The Inspector for Marks & Filters
Essentially, the inspector shows cue output controls, but the appearance of these controls will vary based on which audio output patch is selected in the Show outputs for patch pop-up menu and whether any marks or filters are selected.
If no audio output patch is selected in the pop-up menu, the inspector will display 128 cue outputs labeled with numbers. If a patch is selected, the inspector will show as many cue outputs as that patch contains, labeled however they are labeled in that patch.
Marks
A mark defines how an object should sound at a specific location on the map. To achieve this, marks have four properties:
Position
You can drag marks around to position them, or select them and edit their position textually using the text boxes in the lower right corner of the map.
Levels
When a mark is selected, adjust the levels in the inspector exactly as though you are adjusting the levels on a cue. The level controls here work the same way as other level controls in QLab: you can drag the slider, click and drag within the text field, type in the text field, and option-click in the text field to snap from 0 to -inf.
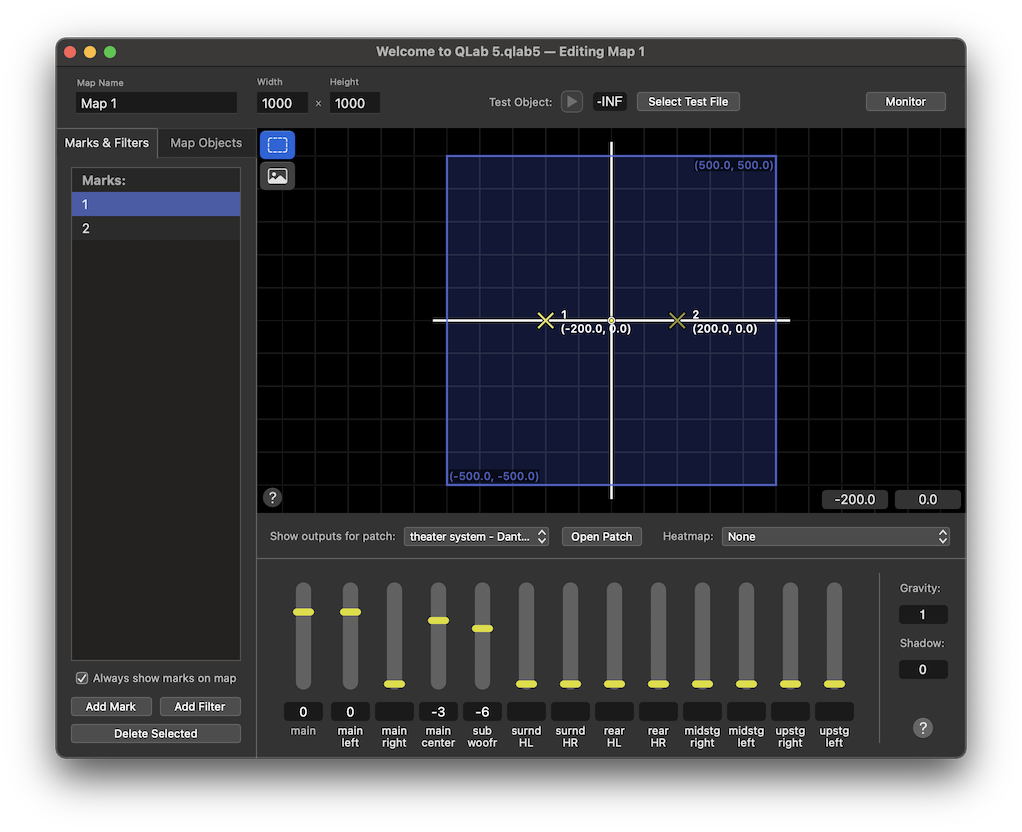
Gravity
The magnitude of the mark’s influence on the map. A mark with higher gravity will exert more influence upon the map than one with lower gravity. The default gravity of a mark is 1, the minimum possible gravity is 0.1, and the maximum is 5.
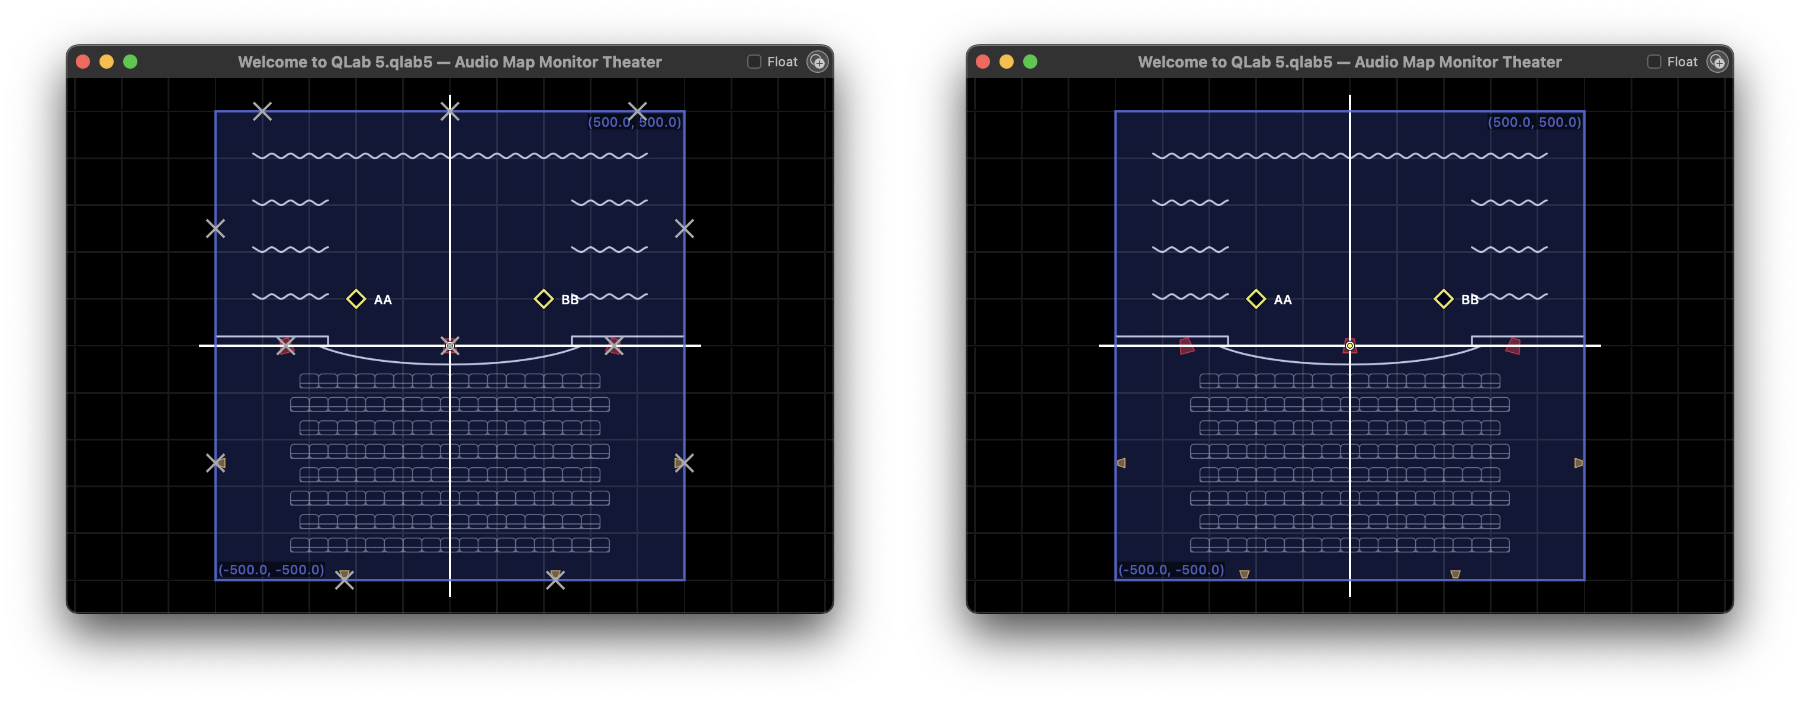
In these images, the gravity of the center mark is 0.1 on the left, 1 in the center, and 5 on the right, while the gravity of the other two marks remains constant at 1. The heatmap shows how the influence of the center mark grows as the gravity increases.
Shadow
The routing of audio from an object is determined based on the relative distance of the object to each mark. Closer marks are more influential, and more distant marks are less influential. When one mark is entirely “hidden” from the object by another, its influence is extremely limited or eliminated altogether. Marks with a larger shadow will hide more objects than marks with a smaller shadow. Shadow is measure in degrees; the default is 0°, and the maximum is 90°.
In these images, the shadow of the center mark is 0 on the left, 45 in the center, and 90. The heatmap shows how the influence of the left mark is constrained by the shadow of the center mark.
Filters
Filters limit the influence of marks; objects on each side of a filter are only influenced by marks on the same side of the filter. However, filters may optionally be set to ignore specific cue outputs, allowing the behavior of those outputs to remain unaffected by the filter. Additionally, marks which sit within the width of a filter are unaffected by the filter.
Filters have four properties:
Position
You can drag marks around to position them, or select them and edit their position textually using the text boxes in the lower right corner of the map.
Levels
By default, a filter blocks all influence. Objects on one side of the filter cannot “see” marks on the opposite side. When one or more filters are selected, the inspector displays a row of checkboxes for each cue output.

When a box is checked, that cue output passes through the filter. This means the filter no longer blocks all influence of all marks. Objects will “see” marks on the opposite side of a filter, but they will only “see” the marks’ influence on the cue outputs which are set to pass through.
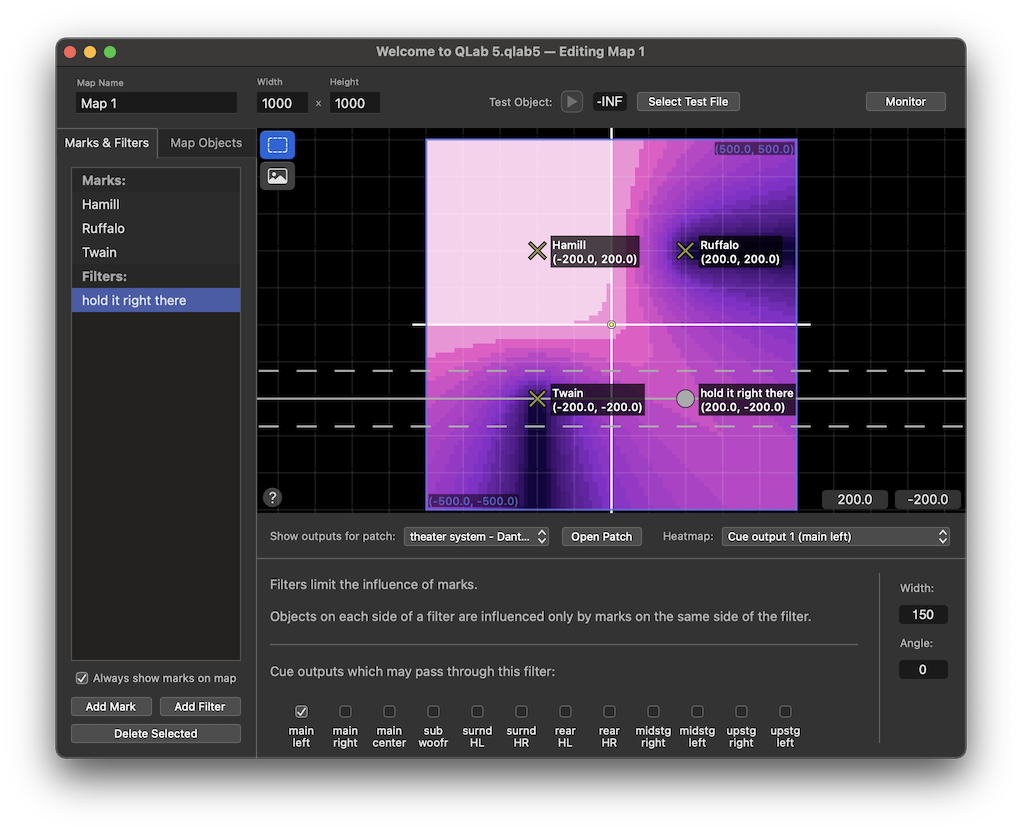
The heatmap is showing cue output 1 (main left). Since the checkbox for main left is checked, that output is exempted from the filter. As far as cue output 1 is concerned, there is no filter.
Width
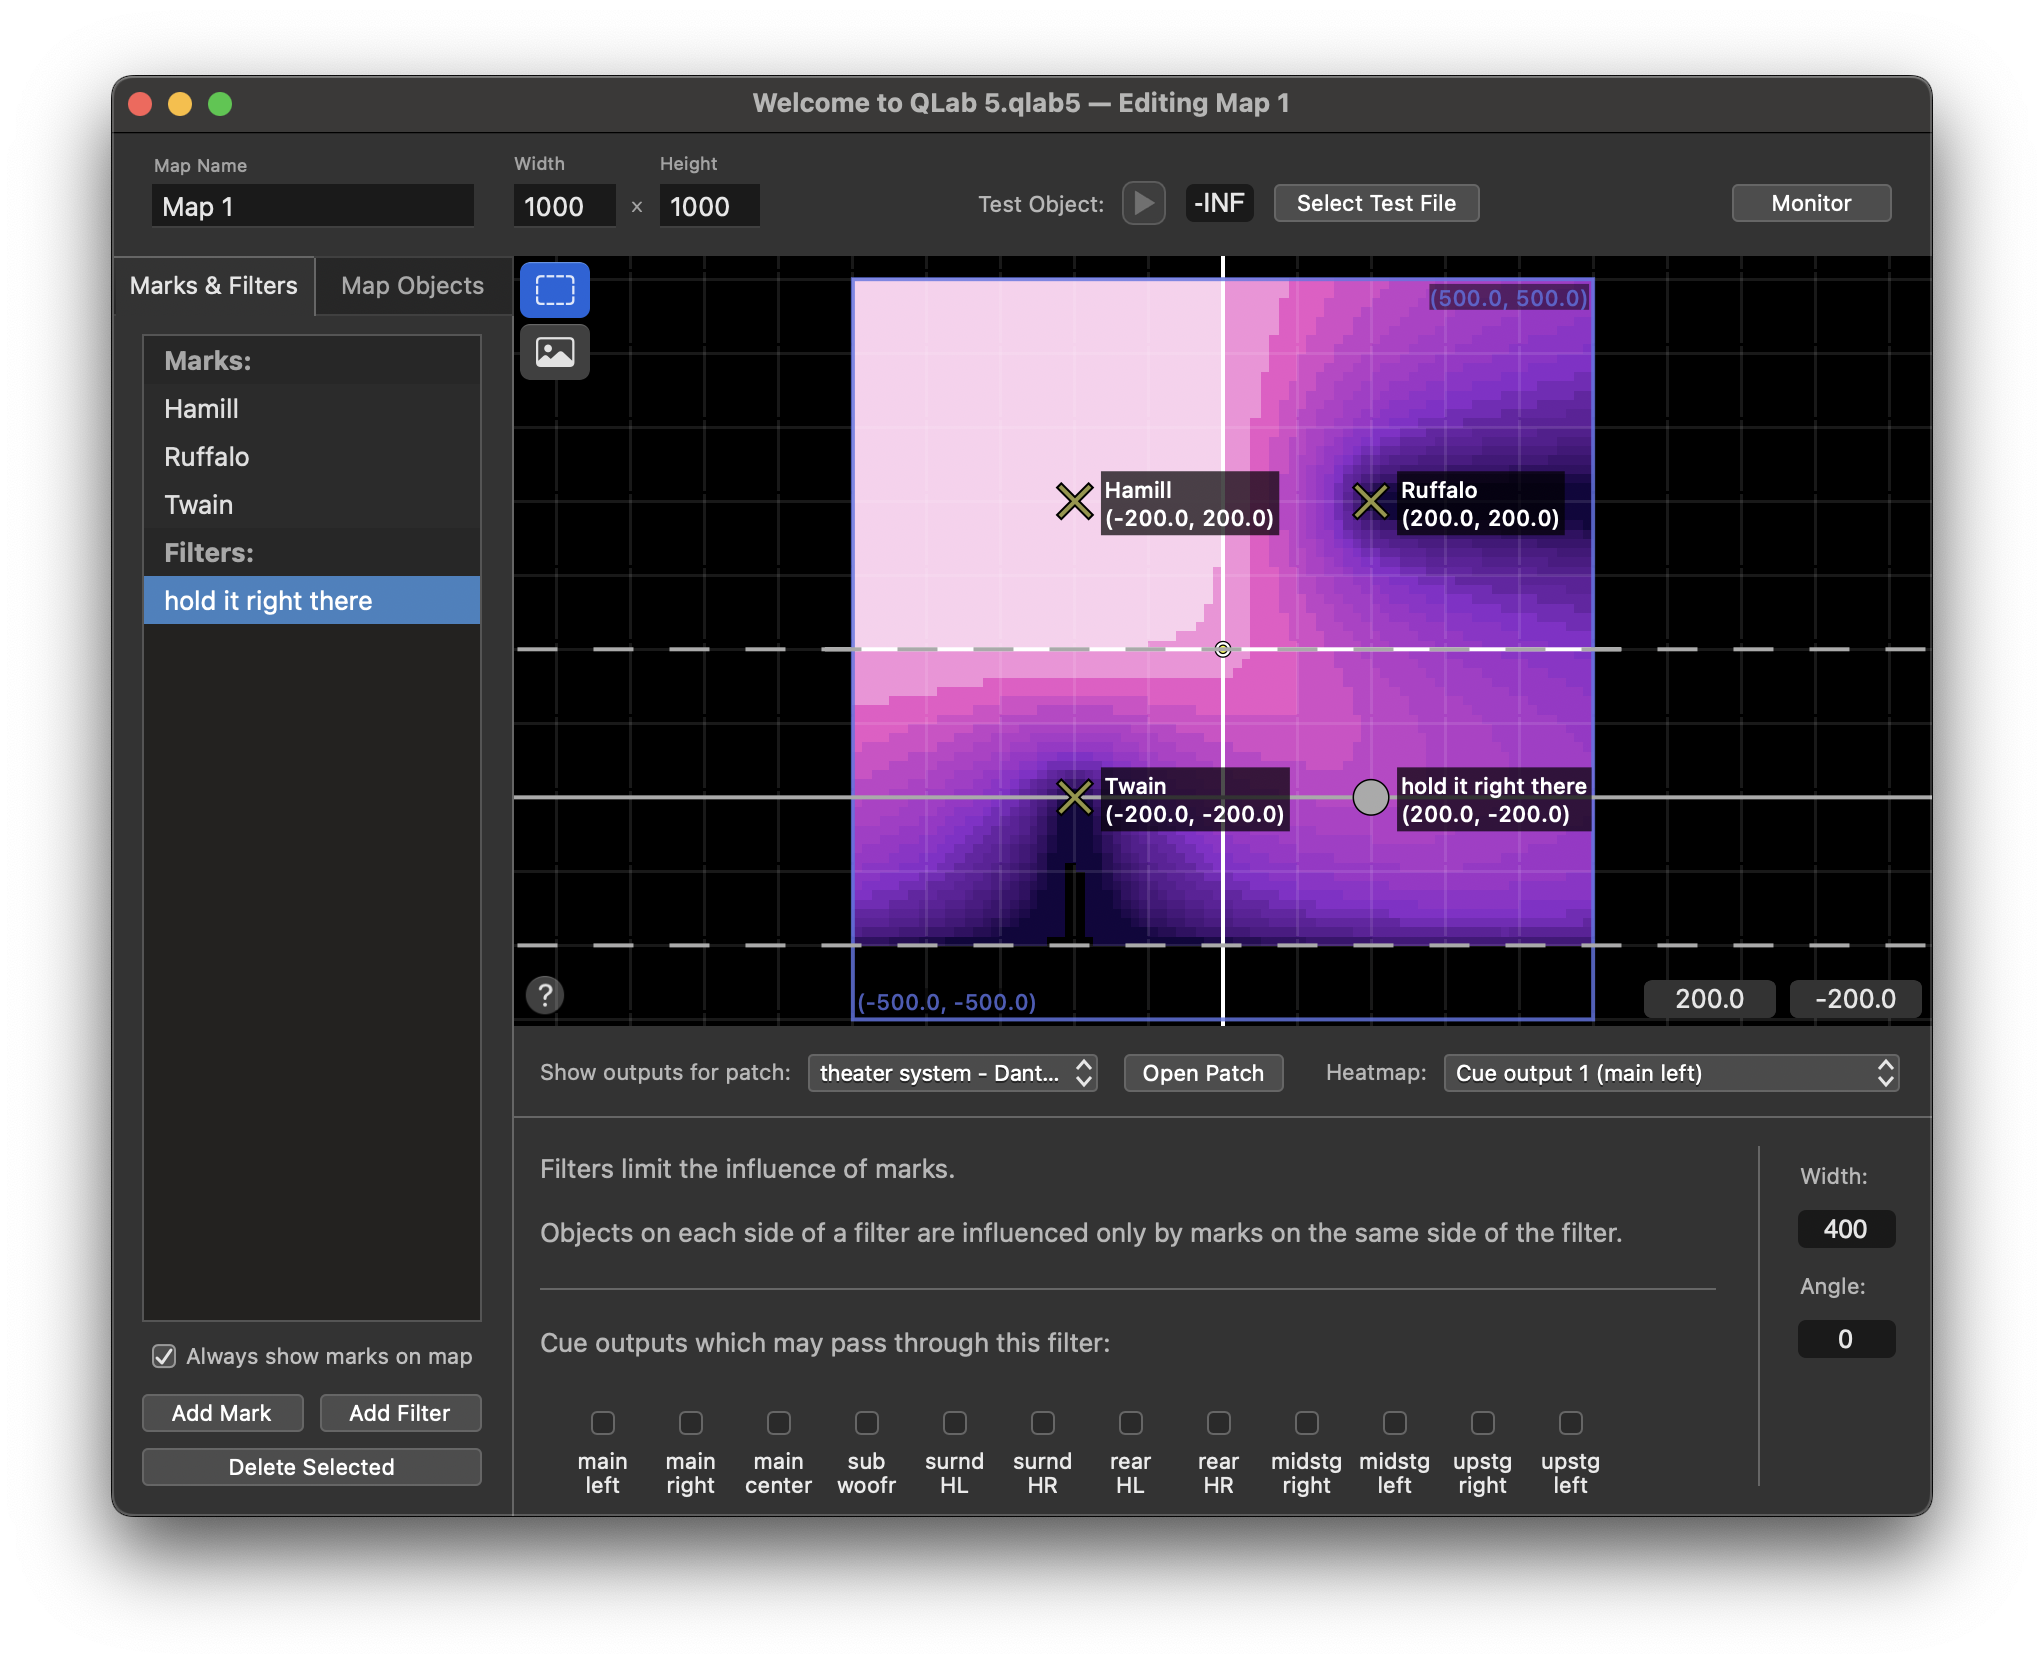
The width of a filter determines how gradually or sharply its effect is applied. You can adjust the width of a filter by clicking and dragging on either one of its two dashed lines, or you can use the text box in the lower right corner.
Angle
You can adjust the angle of a selected filter by clicking and dragging on its center line, or you can use the text box in the lower right corner.
Map Objects
The Map Objects tab displays a list of the objects that belong to the map. You do not need map objects to use object audio; cues can have their own objects too. Map objects are useful when you want to send audio from multiple cues to one object that can be positioned and controlled consistently. You might, for example, create a map object to correlate with a prop radio on stage, and send all the Audio cues for the radio through that map object. When an actor picks up the radio and moves to another spot on stage, you can use a Fade cue to move the map object accordingly, without worrying about which Audio cue is playing at the time.
Map objects are named using double letter by default, but you can rename them in the list as well as reorder them.
Below the list, the Always show marks on map checkbox lets you display or hide the mark icons in cue inspectors, monitor windows, and the Map Objects tab. Only the marks’ visibility is affected, not their behavior.
The Add Map Object button adds a new mark to the map. You can also add a map object by right-clicking (or control-clicking or two-finger-clicking) in the canvas.
The Delete Selected button, which is only available when at least one map object is selected, deletes the selected object(s). You can also use the ⌫ key. Deleting is undoable, of course.
The Canvas for Map Objects
When the Map Objects tab is active, map objects are displayed on the canvas with their name and coordinates. If the Always show marks on map checkbox is checked, marks are also displayed, though without their names and coordinates.
The help button at the bottom left of the canvas displays a list of the keyboard shortcuts and modifiers that are available when working in the canvas.
The Inspector for Map Objects
Map objects have two properties.
Spread
The spread of an object is its apparent size on the map. The default spread is 0, which means an object’s position is measured as a single point on the map, even though objects are drawn much larger than than in order to make it easier to see and interact with them.
When the spread of an object is larger than 0, QLab calculates its routing as though it occupies every point within its spread. An object’s level in each cue output will be as loud as the loudest point within its spread.
Color
Objects can be given a color to make them stand out in the map. There are twenty colors to choose from here, divided into eight “basic” colors and twelve “extended” colors. The color doesn’t alter the behavior of the object in any way, so feel free to use color coding in whatever way is most useful to you.
Objects set to “no color” will be drawn in yellow when they are selectable, in yellow and filled when they are selected, and in grey when they are not selectable.
Reset
If any map objects have been moved by Fade cues, the Reset button becomes available. Clicking it will reset all map objects of the map to their home positions.
The Test Object
The test object makes it easy to listen to your map as you develop it, rather than jumping back and forth between a cue in your cue list and the audio map editor. The test object lets you play an audio file of your choosing and move it around the map with minimal setup.
To use the test object, first be sure to select an audio output patch in the Show outputs for patch pop-up menu. Without that, the map has no connection to any actual outputs, so you won’t be able to hear anything.
Next, click the Select test file… button and choose an audio file to use as your test audio.
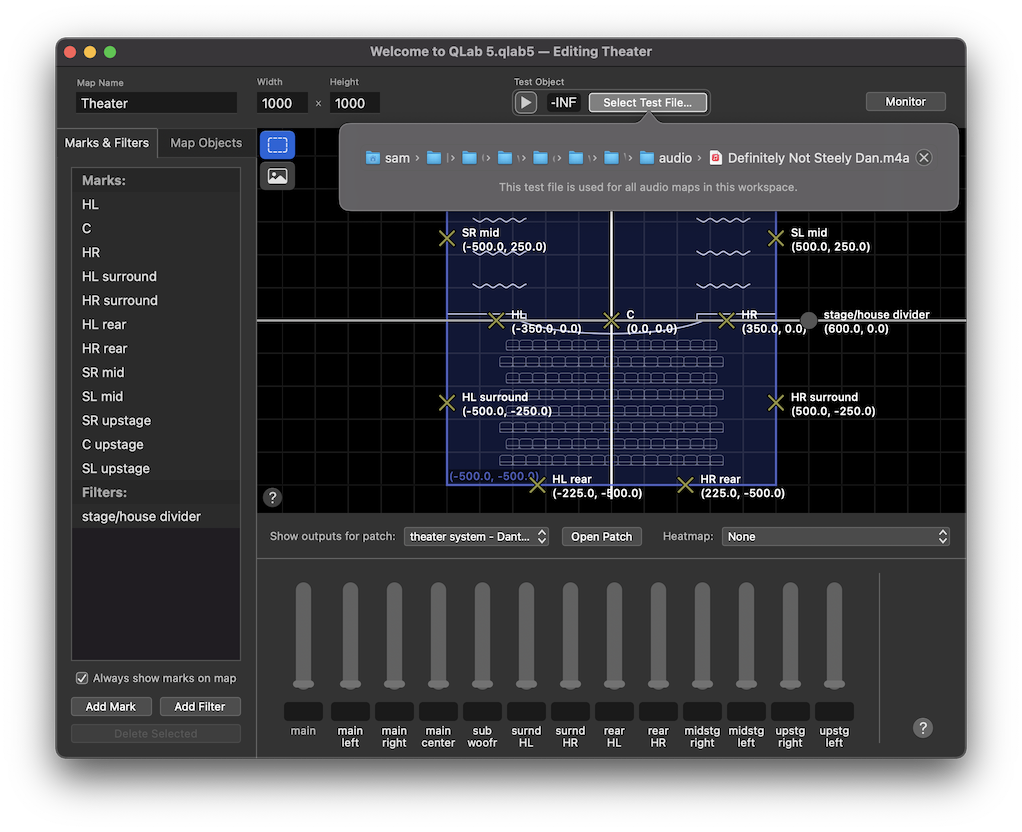
Please be advised that certain choices of test material may have social consequences. It is beyond the scope of this manual to advise the reader on the finer points of this topic.
Once a file is selected, you can click the button to start the test object. It will appear in the center of the map in green, and can be moved around as you please. The level of the test object starts off at -inf and can be adjusted like any other level in QLab.
Still have a question?
Our support team is always happy to help.

